Why most AEO tools give you noise (and what a real test bed looks like)
Most AEO dashboards report rate moves without uncertainty bounds. Here's the math and the prompt-set, variance, and trend tests every measurement should pass.
Ben Moore
Ex-Stanford AI Researcher specialising in search algorithms and LLM optimisation.
May 3, 2026
Published: May 3, 2026|Updated: May 3, 2026
11 mins
TL;DR. Most AEO dashboards report rate moves without bounding the noise, so marketing leaders chase shadows. A real test bed needs three things: variance bounds on every snapshot, a prompt set that clears coverage, confound, and brand-anchor checks, and a trend test built on credible intervals plus a Bayes factor against no change. Skip any of the three and you are reading randomness.
Your monthly AEO report says citation rate moved from 12.4 percent to 12.9 percent. Is that real, or is it noise? Most AEO tools cannot tell you. They show the line, label the move, and leave the question of whether it survived the underlying randomness for the reader to figure out. That is how marketing leaders end up chasing shadows for a quarter, then quietly walking the conviction back when the rate returns to baseline.
Before AEO, I built fraud-detection systems for customers like Ramp and Plaid. Telling signal from noise was the entire job. Most of what I write below is the same statistics applied to a different kind of stochastic system. The good news is that the math is fully solved. The bad news is that very little of the AEO tooling on the market today applies it.
This post is what we use at Discovered Labs as our AEO test bed. Three things have to be true before anyone reports a move as real: the variance bounds on each snapshot have to be quantified, the prompt set has to clear three orthogonality checks, and the trend itself has to pass a sustained-shift test. Skip any of the three and you are reading randomness.
Why AEO outputs are stochastic in the first place
If you have ever sent the same prompt to ChatGPT twice and gotten different answers, you have already seen the problem. There are two structural sources of that randomness, and both matter for measurement.
1. Kernel and batching dynamics. When you send a prompt to a frontier model, your request lands on a GPU running an inference kernel. To stay efficient, kernels batch many user requests together, and different batch sizes dispatch different reduction strategies. The outputs are not bit-exact across them. Thinking Machines Lab's recent work on defeating non-determinism traces this directly to batch-size variance, not to the more commonly cited floating-point non-associativity.
2. Sampling at temperature greater than zero. Most production endpoints sample with temperature above zero. Temperature is the dial that controls how much randomness goes into each next-token decision. Set it above zero and identical inputs produce different outputs by design.
The TLDR: same prompt, same model, different runs produce different answers. That is structural, not a bug.
Two sources of noise in any AEO measurement
Once you accept that model outputs are stochastic, there is a second layer of randomness sitting on top: your prompt set. Unless you want to spend a small fortune, the number of prompts you can run is finite, and the population of buyer queries you are trying to represent is enormous and largely unknown. Every measurement is a finite sample of that population, with its own sampling error.
So any AEO snapshot is a sample affected by two distinct types of noise:
Model-level noise. Same prompt, same model, different runs return slightly different answers. Kernel and batch dynamics, as above.
Sampling-level noise. The prompts you chose to test are a finite sample of the population of queries buyers actually ask. A different sample would give a different result, even if the model were perfectly deterministic.
Bounding an AEO trend means bounding both. We treat each AEO measurement as a sample from an unknown true rate, with bounded uncertainty, and we apply estimation theory. It is the same math used in robotics and perception systems to make decisions under noise.
What drives the noise bounds
Three things determine how tight the bounds on any AEO measurement can be. Each one is a lever you can actually pull.
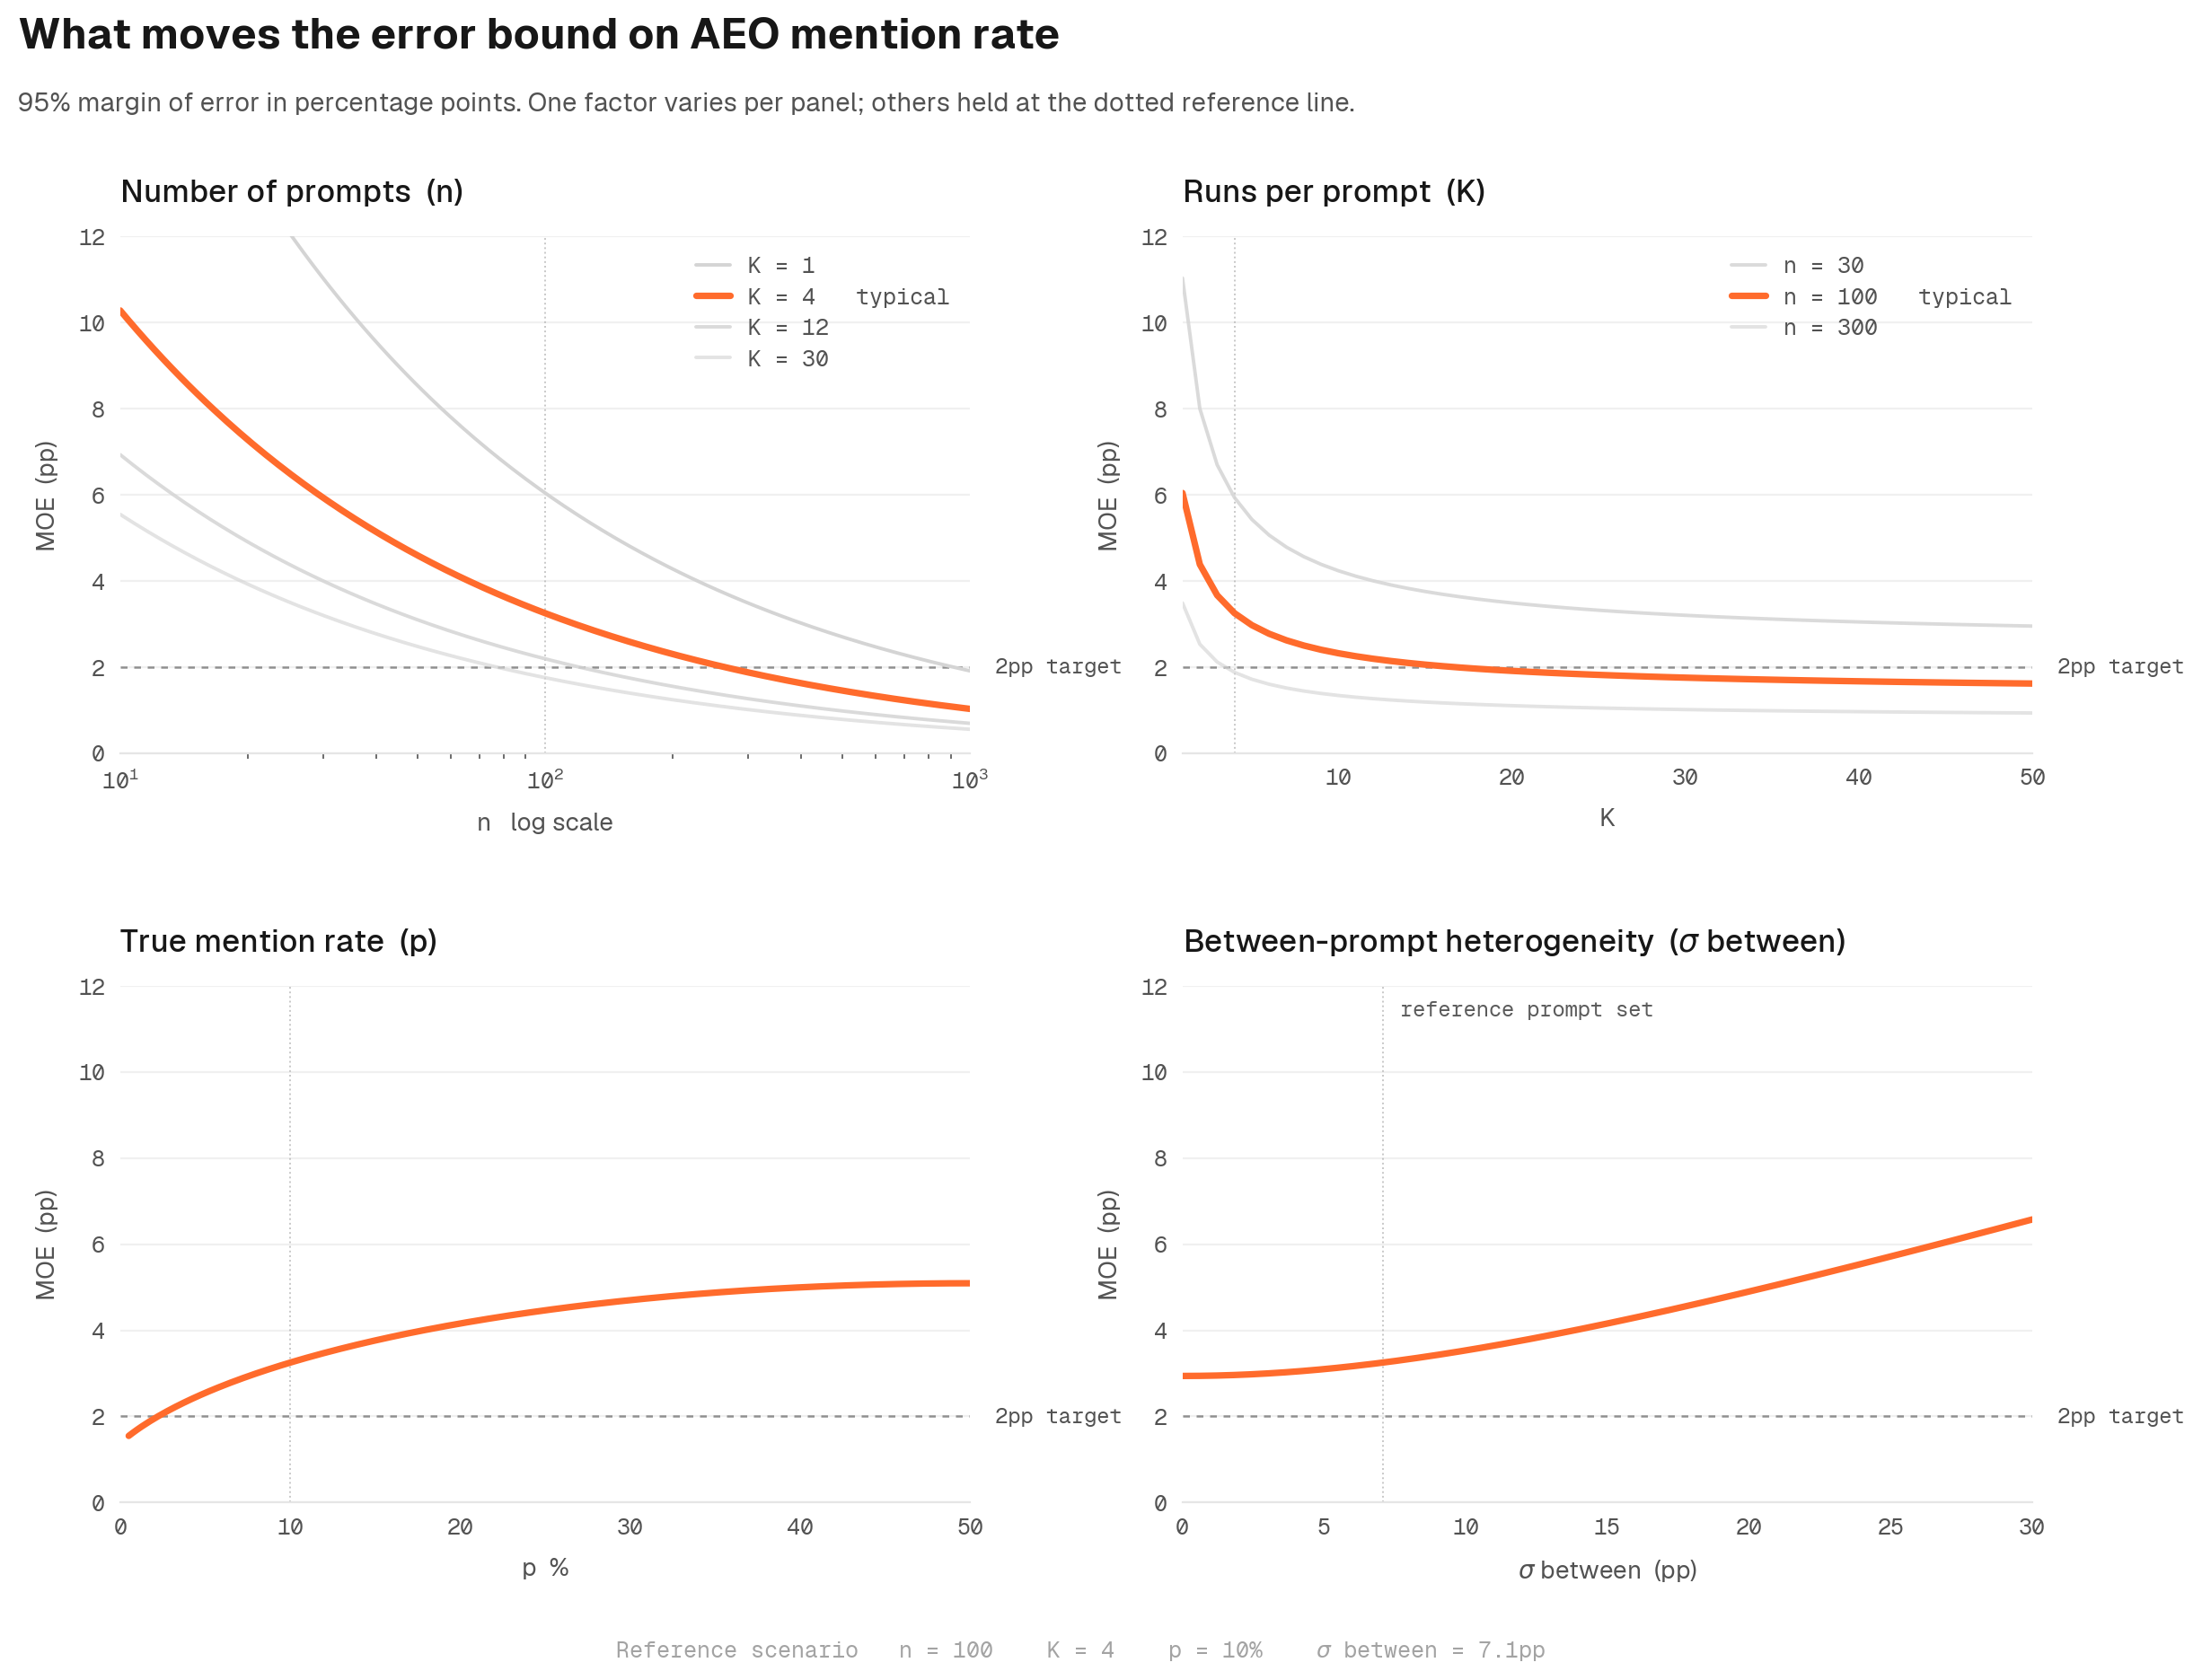
Sample variance shrinks with the square root of n. Double your prompt set and your uncertainty interval shrinks by about 30 percent. Quadruple it and you halve the interval. There is no shortcut around this.
Variance decomposes into pieces you can act on. Total uncertainty equals between-question variance, which comes from the prompts you asked, plus within-question variance, which comes from kernel and sampling noise on each prompt. The first is structural, fixed by the prompts you chose. The second is reducible by resampling each prompt K times.
Confidence intervals are just bounded uncertainty. Saying "the true citation rate is in 11.8 percent to 13.2 percent with 95 percent confidence" is a precise quantitative statement, not a hedge. You can compute exactly how many prompts and resamples you need to hit any target precision before you run a single test.
Anthropic's Miller paper, Adding Error Bars to Evals (November 2024), puts all three into the LLM-eval setting specifically. We use it as the canonical reference for how variance bounds should be computed inside Discovered Labs.
Three factors that drive how tight the error bounds on any AEO measurement can be.
The implication for marketing leaders is simple. AEO trend reports need to be evaluated with full visibility into variance and significance. Without it, you will be fooled by randomness more often than not.
Three orthogonality checks every AEO prompt set should pass
Variance bounds are necessary but not sufficient. Selection bias upstream washes out the best math downstream. Before any AEO trend is meaningful, the prompt set itself has to clear three orthogonality checks. Most prompt sets we see at onboarding fail at least two.
1. Coverage: does the prompt set span the buyer-query manifold?
Most AEO prompt sets are hand-picked by an SEO manager. That is a selection-biased sample from the unknown super-population of queries buyers actually ask. You do not know what you are missing, which is exactly the problem.
The fix is to approximate the true buyer-query distribution from first-party data, then select prompts that minimise KL divergence to it. In practice that means pulling 500 to 2,000 candidate prompts from real buyer signal: GSC queries, support tickets, forum posts, Reddit threads. Embed them, cluster the embeddings, and select representatives across the manifold so the prompt set covers the territory rather than concentrating on one corner.
2. Confound control: what surface variables are actually driving the variance?
If two prompts about the same topic produce different mention rates, that may be because the topic is genuinely sensitive to wording. Or it may be because one prompt is twice as long as the other, or uses more formal language, or has a higher type-token ratio. Without controlling for the surface form, you cannot tell.
The fix is to build a feature matrix of surface stats, length, type-token ratio, formality score, and use them as control regressors to filter out variance attributable to surface form. What is left, the residual, is the part that is genuinely about topic.
Hand-crafted features approximate what a generic encoder sees. The upgrade is to add the model's own final-token hidden state, for example a Gemma 2 9B layer 16 representation, as additional regressors. That captures how the model itself groups the prompts, which is closer to the truth of what is driving the response.
3. Brand-anchor audit: are the prompts leading the model?
If a prompt mentions the brand being measured, the model is much more likely to mention that brand in the response. The mechanism is more direct than the human bias version. Every token in the prompt gets attended to during generation. When the prompt contains a brand name, the model's attention heads keep that brand token in working memory at every step of the response, biasing the next-token distribution toward emitting it.
The audit is straightforward:
Regex-scan every prompt for mentions of the tracked brand.
Bucket each prompt as anchored or unanchored.
Compute mention rate per bucket.
The gap is the anchoring inflation factor.
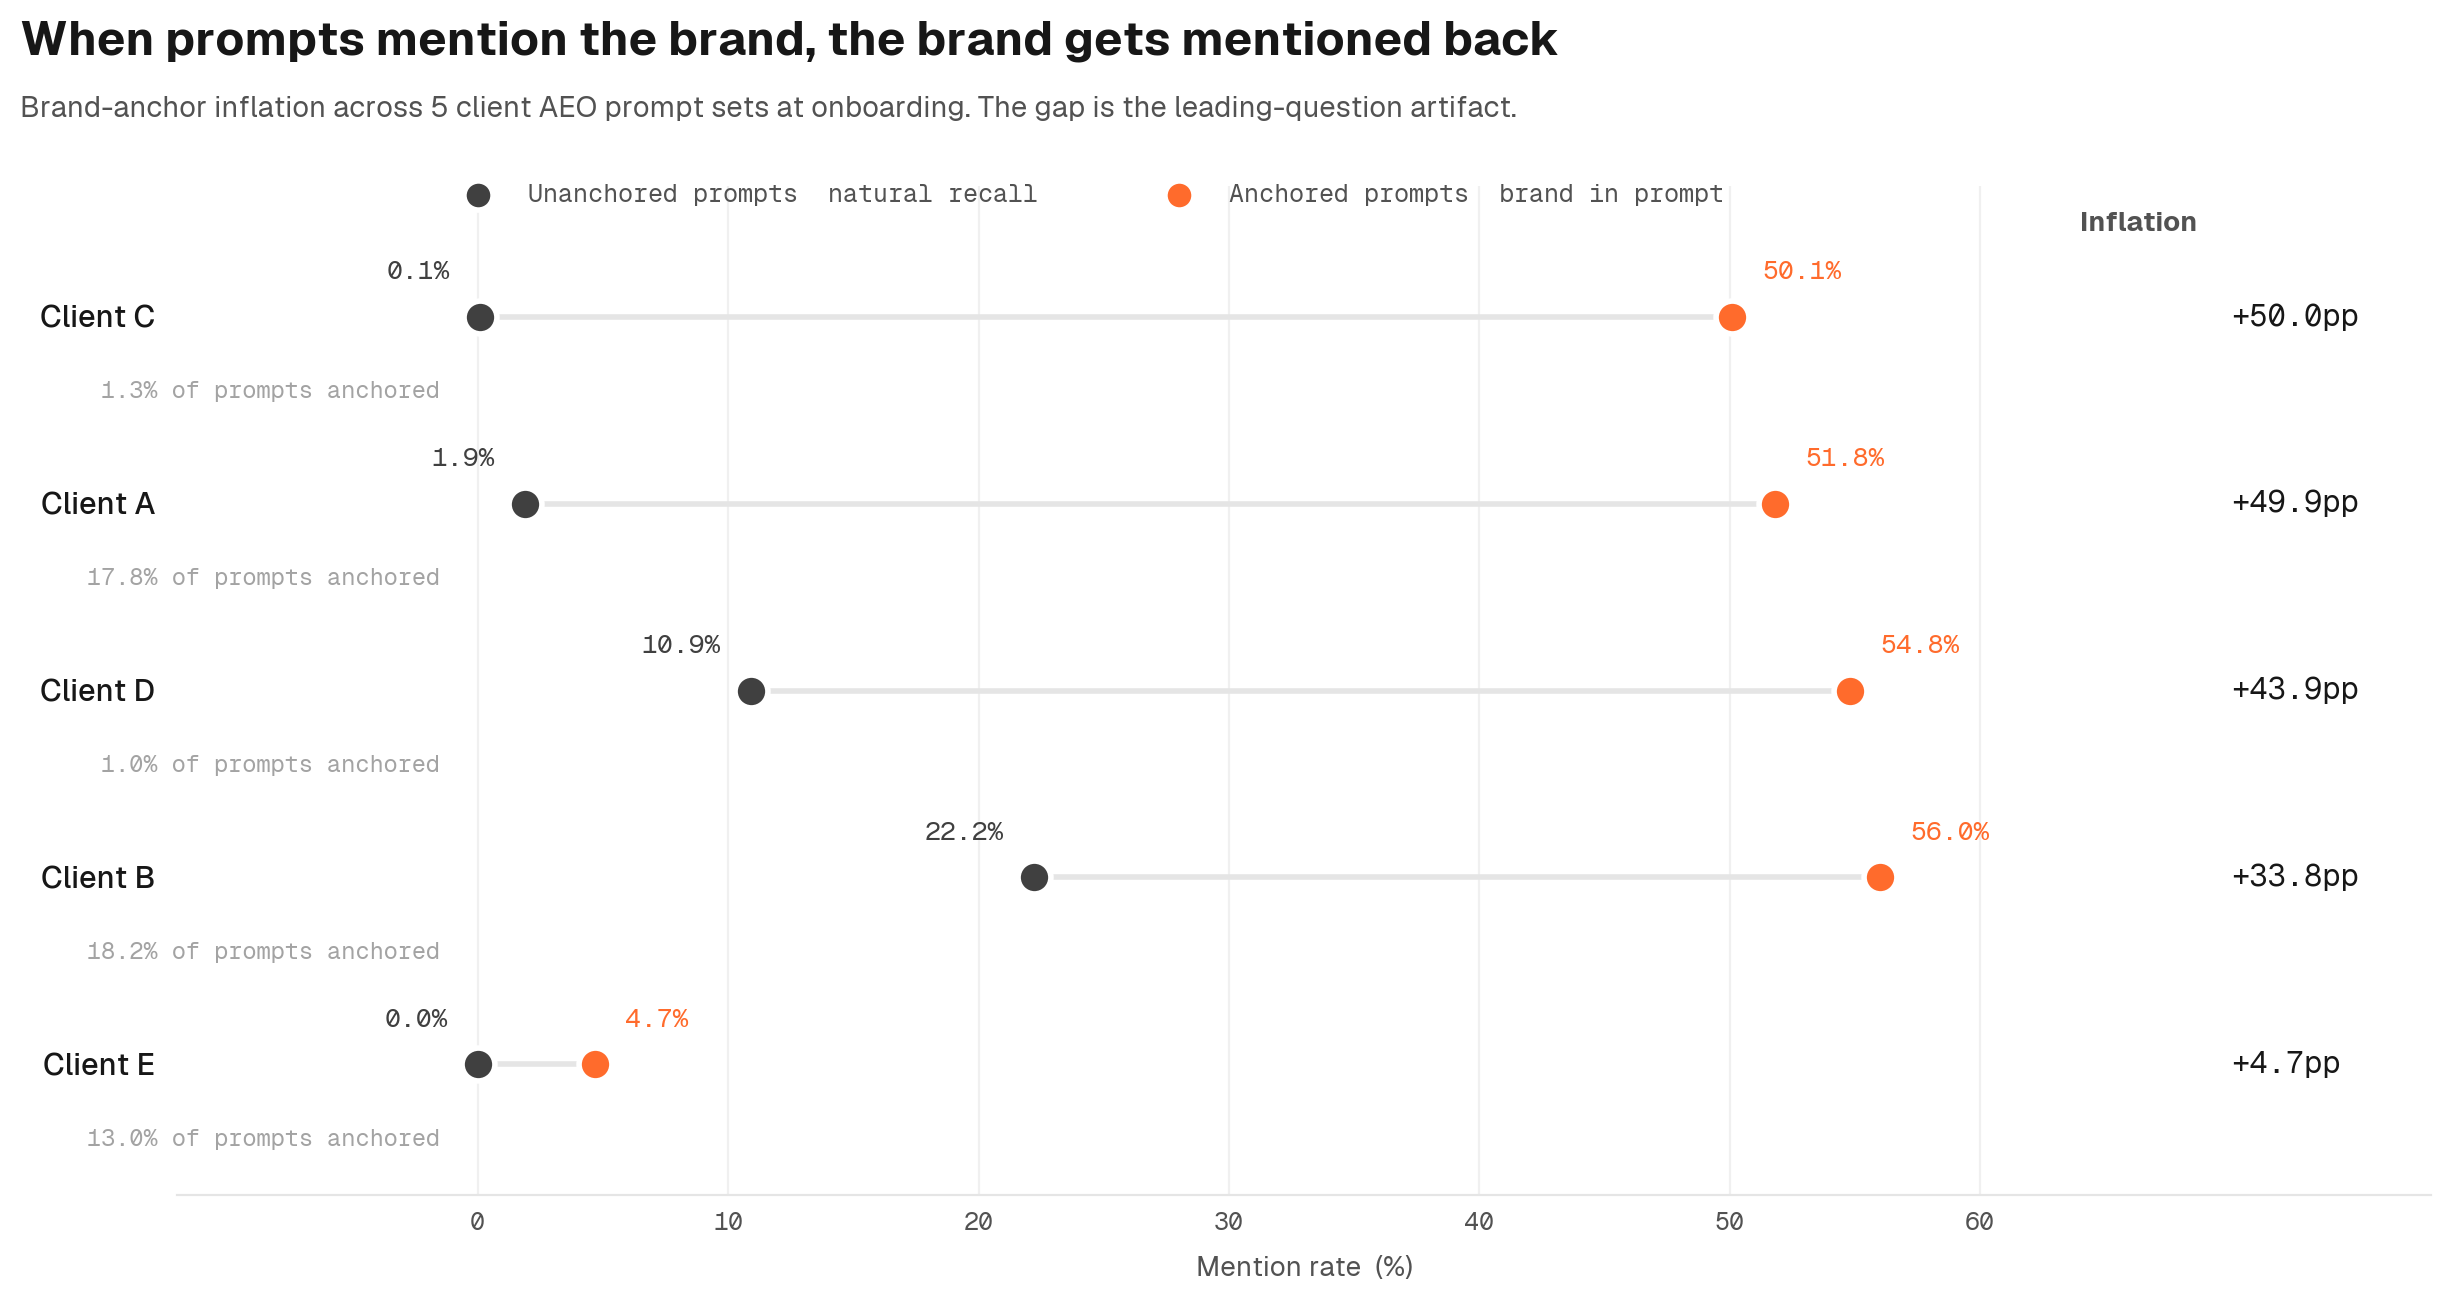
We audited 5 prompt sets that B2B SaaS clients gave us at onboarding. All 5 had measurable anchoring inflation. In the most extreme case, the reported aggregate mention rate was 10.8 percent. The unanchored rate, the actual natural recall of the brand by the model on neutral prompts, was 1.9 percent. Most of the reported signal was the prompts asking about the brand by name. A major flaw right from the start.
Anchored vs unanchored mention rates across 5 anonymised client prompt sets. The gap is the anchoring inflation factor.
The 3-question test for AEO trend significance
Variance bounds and a clean prompt set get you to a defensible snapshot. The next question is whether a change between snapshots is real. Self-driving perception systems do not say "pedestrian detected." They say "pedestrian detected with 87 percent confidence." Without the uncertainty number, the signal is not actionable. AEO dashboards still report citation-rate trends without confidence bounds. They should not. Three tests should pass before anyone freaks out or chases their tail.
1. What is the credible interval on each snapshot?
A 50-prompt run has different uncertainty than a 1,000-prompt run. The credible interval is the range your true rate likely falls in. It is similar to a confidence interval, but Bayesian: sample-size aware, no p-value gymnastics. A Beta-Binomial posterior gives a 95 percent interval that scales with how much data each snapshot is built on. Most tools ship moving averages instead, which is the wrong tool for stochastic data.
One quick definitional note. A confidence interval is a statement about the procedure, of the form "if I reran this experiment 1,000 times, 95 percent of the intervals I would get would contain the truth." A credible interval is a statement about the actual answer, of the form "given this exact run, there is a 95 percent chance the truth is in here." Most people read "confidence interval" as if it meant the second one. Credible intervals just match what your brain wants.
2. What is the Bayes factor against "no change"?
How strongly does the data say something actually moved versus nothing happened? A Bayes factor is a ratio: how many times more likely is the observed data if the rate truly changed, versus if it stayed flat. A factor of 100 means the data is 100x more consistent with a real shift than with noise. Above 100 is decisive by convention. Below 10 is "we do not know yet, collect more data."
Most AEO tools never compute this. The result is a feed of false-positive movement claims that look impressive on a dashboard and dissolve under any real scrutiny.
3. Has the shift been sustained?
One out-of-band run is a coin flip. Three or more consecutive snapshots where the new rate credibly exceeds the baseline (probability greater than 95 percent) is real signal. We run a sustained-shift test across multiple consecutive snapshots before any trend is reported as real.
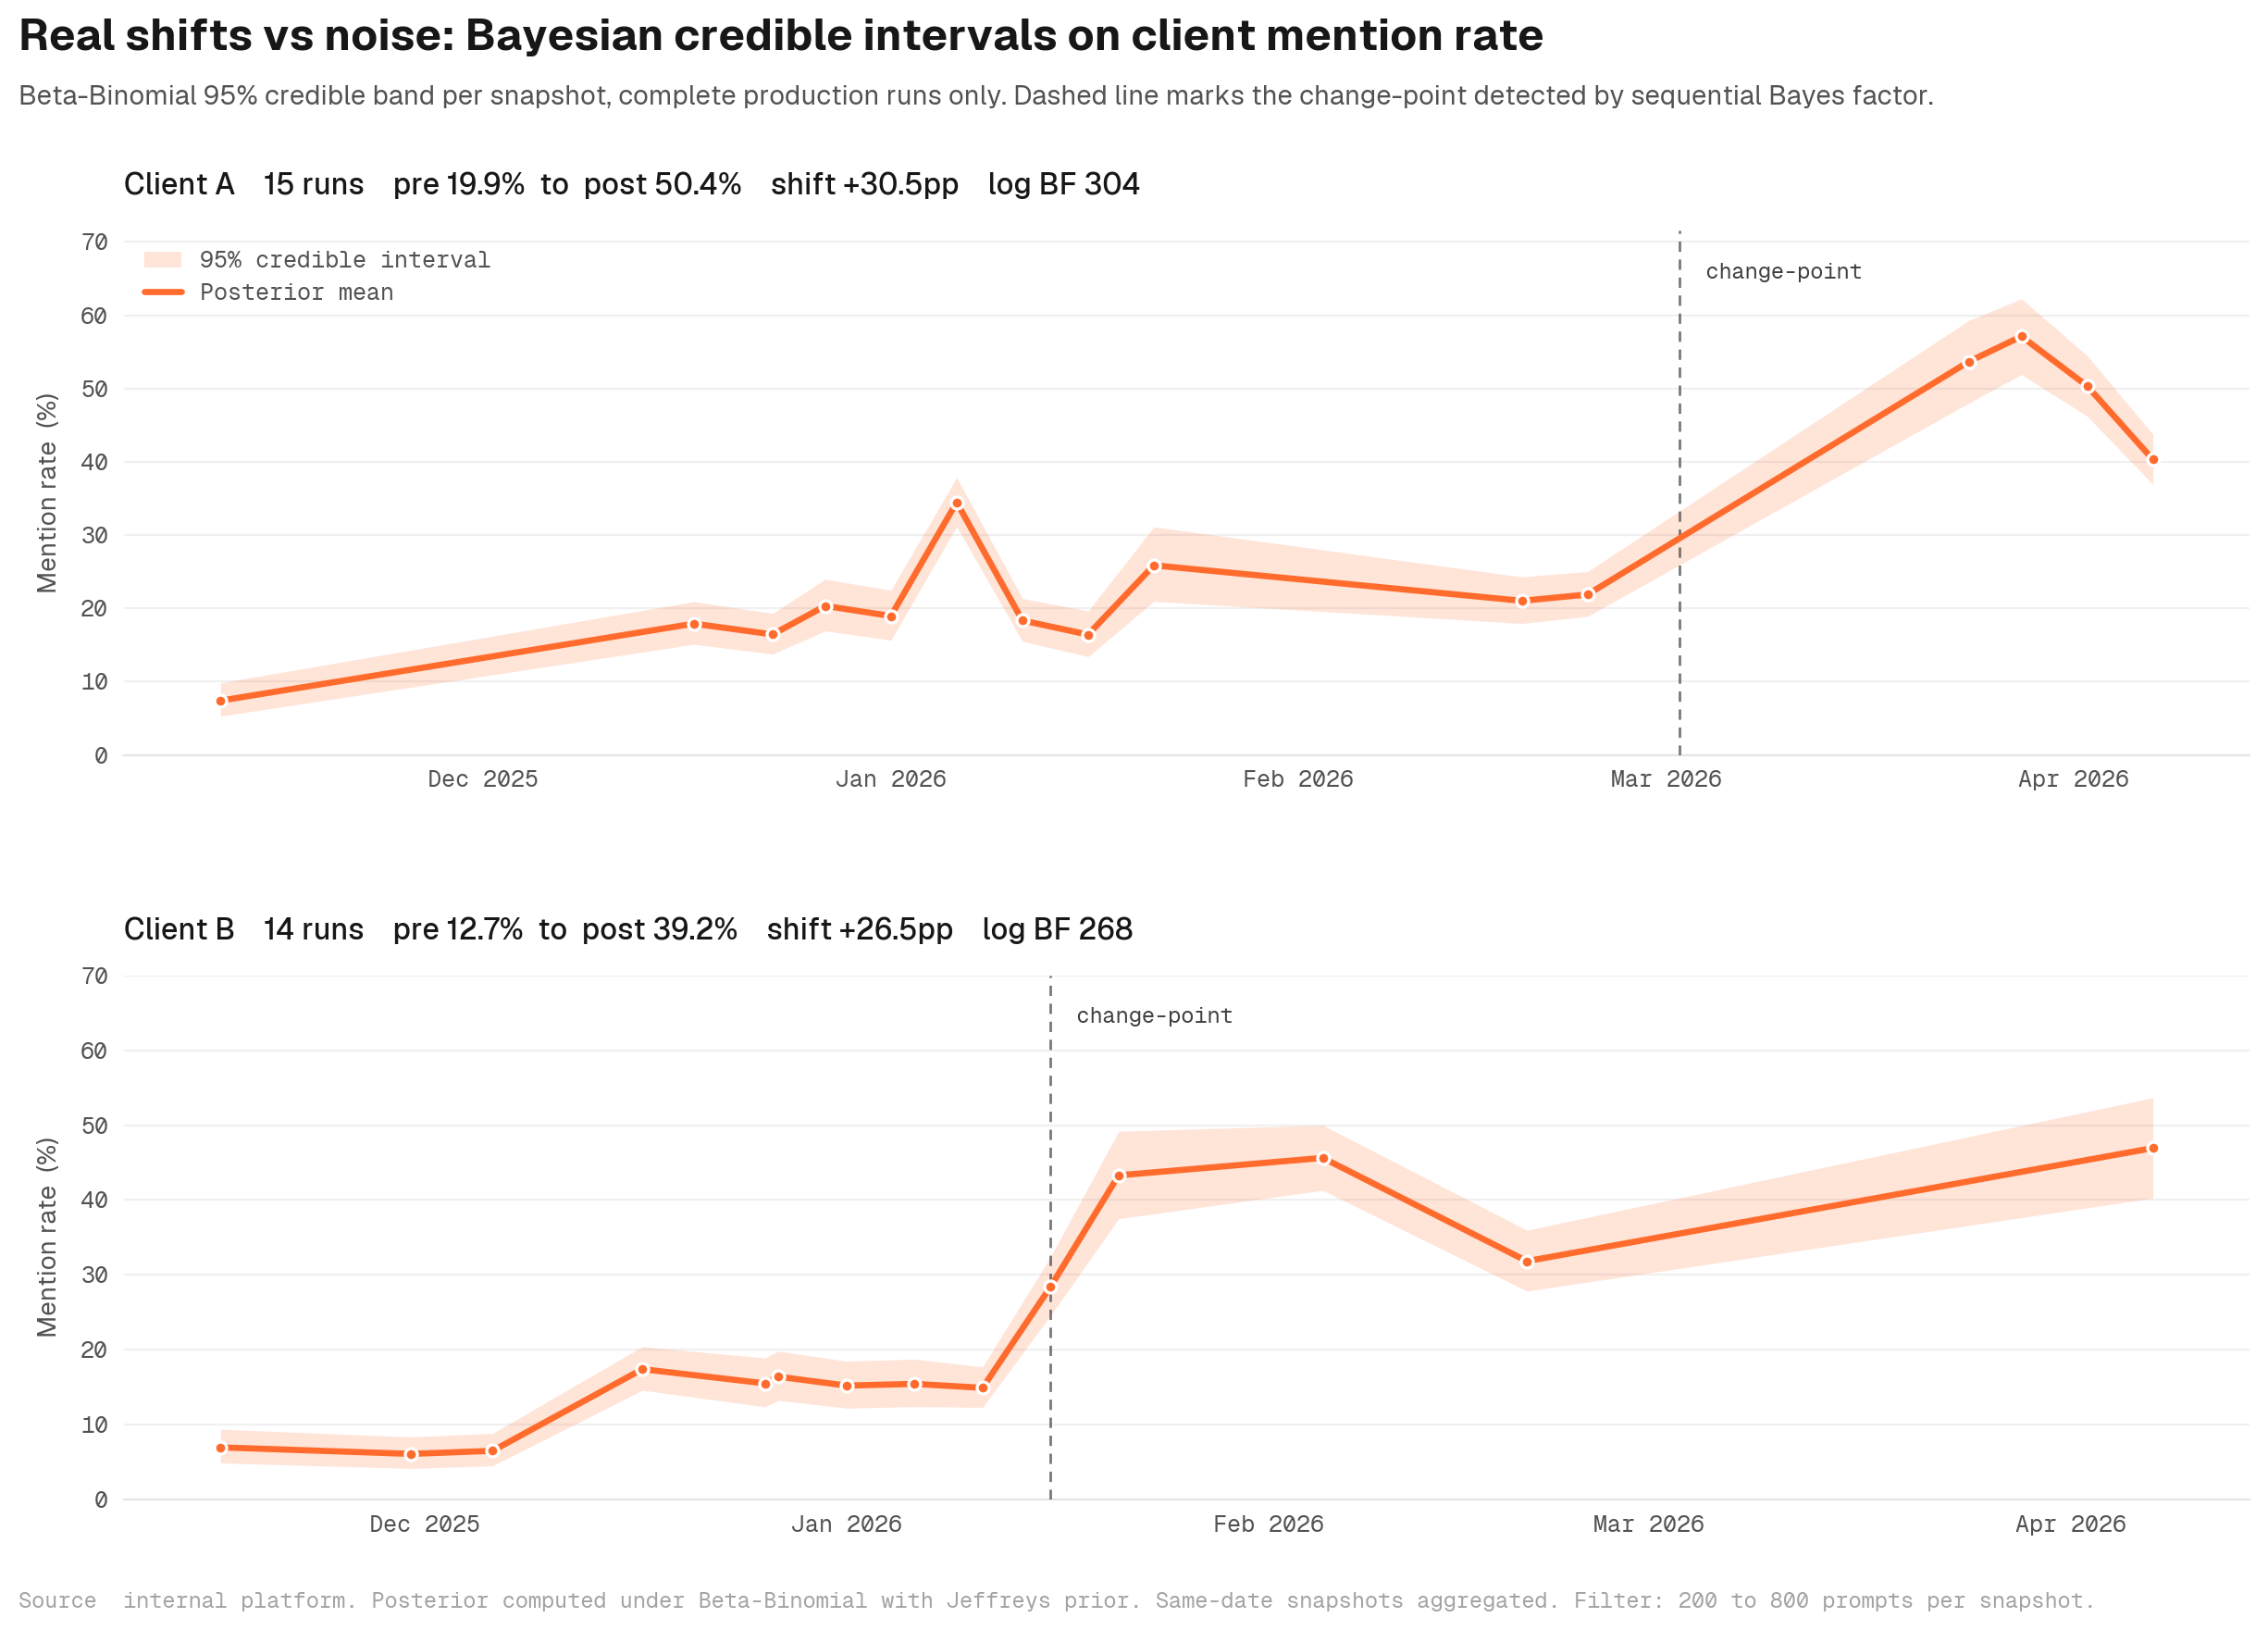
To make this concrete, here is a sample of two anonymised B2B SaaS clients in our database. Both have 25-plus test runs spanning 5-plus months. Both show decisive shifts in mention rate that all three tests detect.
Two anonymised clients with 25-plus test runs. Credible intervals on every snapshot, Bayes factor against no-change, and a sustained-shift test all fire decisively where the visual eye also sees the move.
In both cases the Bayesian sequential test fires decisively. The chart just shows what a real movement looks like when the test bed is set up to detect it.
The buyer's checklist for any AEO measurement
If you are evaluating an AEO tool, an agency, or your own internal reporting, these are the questions to ask before you trust any number on the dashboard.
On the prompt set:
Was the set sampled from a real buyer-query candidate pool, or hand-picked?
Are surface confounds controlled with PCA components used as least-squares regressors?
What percentage of prompts mention the tracked brand? What is the anchored vs unanchored split?
On the variance:
Is there an error bar on every snapshot, the range the truth probably lands in?
Is the prompt sample size large enough that the interval is actually informative? Doubling n shrinks the interval by about 30 percent.
Is the variance decomposed into between-question and within-question components, so you can act on the part you can reduce?
On the trend:
Does the evidence score say "real shift" beats "stayed flat" decisively (Bayes factor greater than 100)?
Has the shift held across multiple consecutive snapshots, not just one weird run?
Are dashboards built on Bayesian credible intervals, or on moving averages that smooth over the noise instead of bounding it?
If any of those answers is no, the measurement is downstream of selection bias, surface form, leading questions, or unbounded variance. The trend is not falsifiable, and you will likely end up chasing shadows.
That is the test bed. Three layers, nine checks, and a clear definition of what a real signal looks like before anyone is allowed to say one moved.
Frequently asked questions
What is an AEO test bed?
An AEO test bed is the measurement system that decides whether a change in your AI citation rate is real or noise. It has three layers: variance bounds on every snapshot, a prompt set that clears coverage, confound, and brand-anchor checks, and a trend test built on credible intervals plus a Bayes factor against no change. Without all three, the dashboard is just shapes.
How is a credible interval different from a confidence interval for AEO measurement?
A confidence interval describes the procedure: if you reran the experiment 1,000 times, 95 percent of the intervals would contain the truth. A credible interval describes the actual answer: given this exact run, there is a 95 percent chance the true rate is inside the interval. Most readers interpret confidence intervals as if they were credible intervals. Bayesian credible intervals match what your brain wants and are sample-size aware out of the box.
How many prompts do I need to detect a real change in AI citation rate?
Sample variance shrinks with the square root of n. Doubling your prompt set shrinks the uncertainty interval by about 30 percent. Quadrupling it halves the interval. Most production AEO benches run 500 to 2,000 prompts to get an interval tight enough to detect a 1-2 percentage point real shift, with each prompt resampled K times to also bound within-question noise.
What is brand-anchoring inflation in AEO benchmarks?
Brand-anchoring inflation is the gap between mention rate on prompts that name the tracked brand and mention rate on prompts that do not. When a prompt mentions the brand by name, the model's attention heads keep that brand in working memory at every step, biasing the response toward emitting it. Audit your prompt set by bucketing anchored vs unanchored, computing mention rate per bucket, and reporting the gap. We have seen reported rates of 10.8 percent collapse to 1.9 percent once anchoring is removed.
What is a Bayes factor and what counts as decisive evidence for an AEO trend?
A Bayes factor is a ratio of how much more likely the observed data is if the rate truly changed versus if it stayed flat. By convention, a Bayes factor above 100 is decisive. Between 10 and 100 is strong but not decisive. Below 10 means collect more data. Most AEO tools never compute this, which is why their dashboards generate a steady stream of false-positive movement claims.
Do I need a separate AEO test bed for ChatGPT, Gemini, Claude, and Perplexity?
The same statistical framework applies to all of them, but each model needs its own snapshot. Different models batch and sample differently, so kernel-level noise has different bounds. Different retrieval pipelines also surface different content, so citation rates and the prompts that anchor brand mentions are not interchangeable. Run the test bed per model and compare cross-model only at the trend-significance layer.
How often should I run an AEO test bed snapshot?
Weekly is the floor for a sustained-shift test that needs three consecutive snapshots above the baseline credible interval. Daily is overkill for most B2B SaaS use cases because the buyer-query population does not move that fast. We run weekly snapshots at Discovered Labs and reserve daily snapshots for periods immediately after a major content or distribution change, when you want a tighter detection window.
Google AI Overviews does not use top-ranking organic results. Our analysis reveals a completely separate retrieval system that extracts individual passages, scores them for relevance & decides whether to cite them.
Our team analyzed network traffic from Google AI Mode in January 2026. The capture included 547 Google flows and over 1,300 total requests during AI Mode sessions. The findings paint a clear picture of how Google is preparing to monetize AI-generated search results.
Google AI Mode is not simply a UI layer on top of traditional search. It is a completely different rendering pipeline. Google AI Mode runs 816 active experiments simultaneously, routes queries through five distinct backend services, and takes 6.5 seconds on average to generate a response.
We breakdown how how AI Overviews work and currently contain zero embedded ads, and traditional SERP ad slots remain intact above and below. But the technical groundwork for future monetization is already visible in the code.